LossToProfit AI
Profit Leak Diagnostic

As businesses grow, some profit leakage becomes harder to notice.

Revenue is not profit. We find where money is leaving inside the revenue you already earn, quantify it in rupees, and prioritise what to fix first.

Six leak areas · evidence-based · nothing presented as guaranteed savings
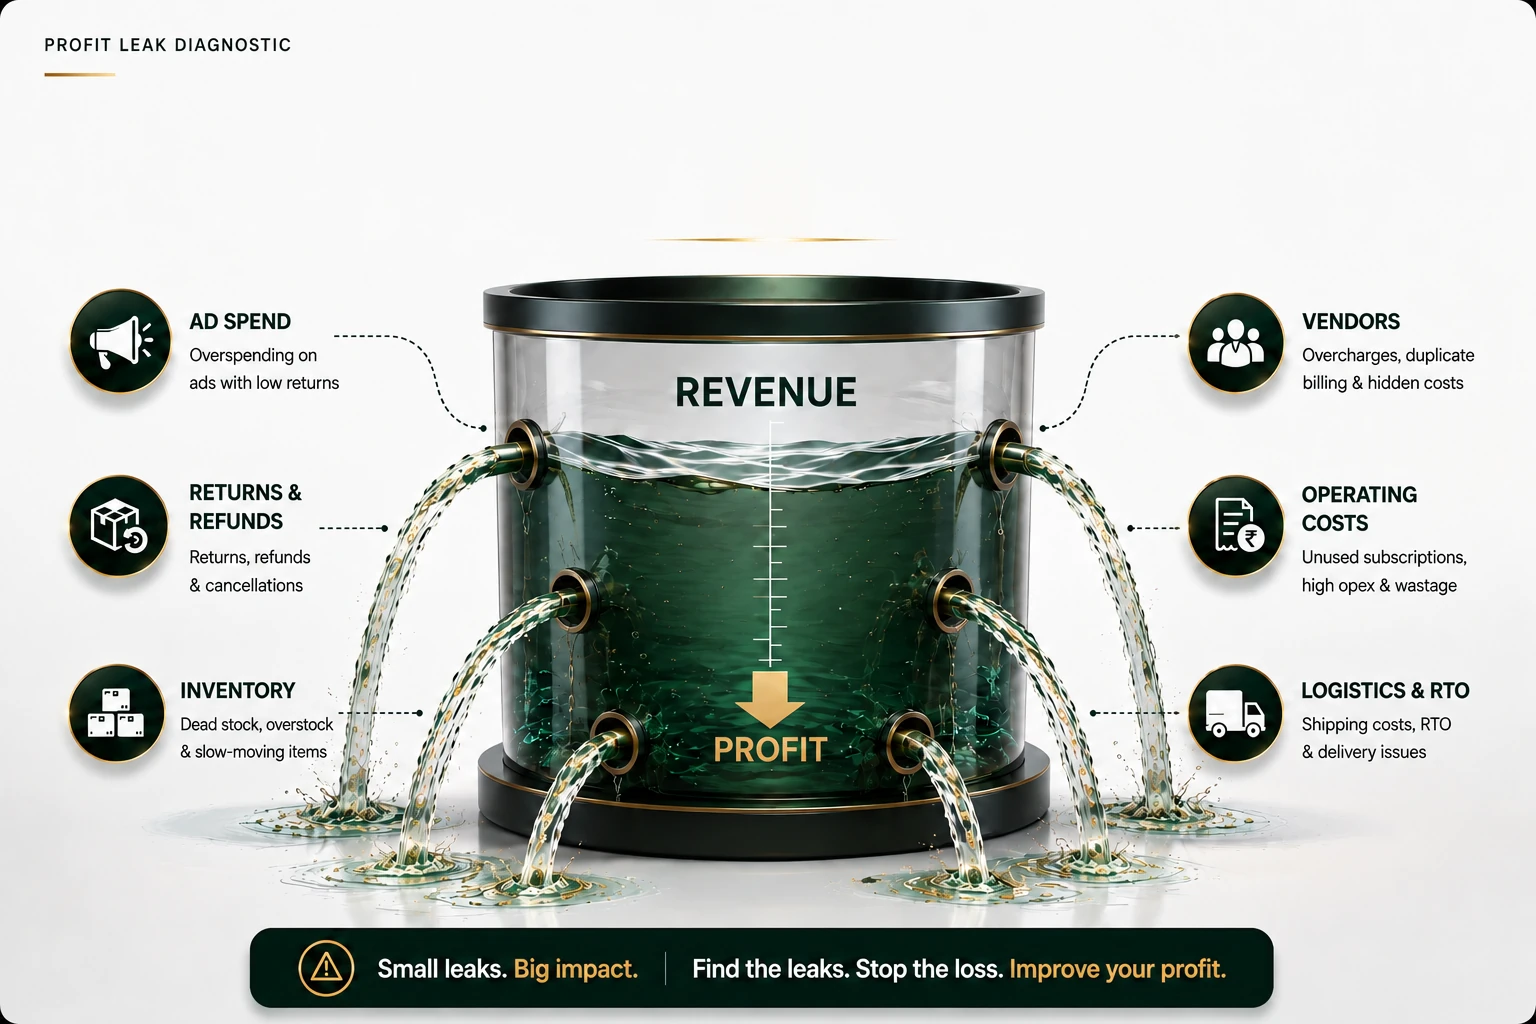
A tank of revenue leaking from six separate outlets, each labelled with a source of profit loss

Where Is Your Profit Leaking?

Six leaks. One profit pool.
29%
of startups fail because of cash-flow problems or running out of cash.
CB Insights — The Top Reasons Startups Fail (2024)
6
leak areas measured, each with a stated formula and a stated assumption.
Ad spend · returns · inventory · vendor · opex · logistics
4 / 6
can be estimated in seconds from numbers you already know. The other two need your documents.
Try it in the calculator below
Where profit goes

Six places profit leaks out of a growing business.

Each is measured from your own data with a stated formula and a stated assumption. No black box — you can check every number.

Wasted Ad Spend

Campaigns spending more than they return, measured against the breakeven ROAS you actually need to be profitable — not an industry average.

spend × (1 − ROAS ÷ breakeven), per campaign

Return / Refund Leakage

The margin lost on returns above what is normal for your category. Counts product value only — the courier cost of the same parcel is measured separately.

(actual − benchmark) × orders × AOV × cost impact

Inventory Leakage

What dead stock, overstocking, stockouts, shrinkage and expiring batches quietly cost every month. The capital locked in unsold and excess stock is reported separately.

holding cost + lost margin + shrinkage + write-off

Vendor Overcharge

What you pay for packaging, raw material and services against two or three real market quotes for the identical spec.

(your cost − market cost) × monthly volume

Operational Cost Creep

Subscriptions, tools and services still being paid for and no longer actively used. Found in a bank statement, not a guess.

sum of every line marked not in use

Logistics, RTO & Returns

Courier overcharge against market rates, plus the real cost of every parcel that comes back — and the capital locked while it is in transit.

shipping overcharge + RTO cost + return cost
The diagnostic, slide by slide

How a leak becomes a number, and a number becomes an action.

Click any slide to enlarge it. Use the arrows or arrow keys to move through the story.
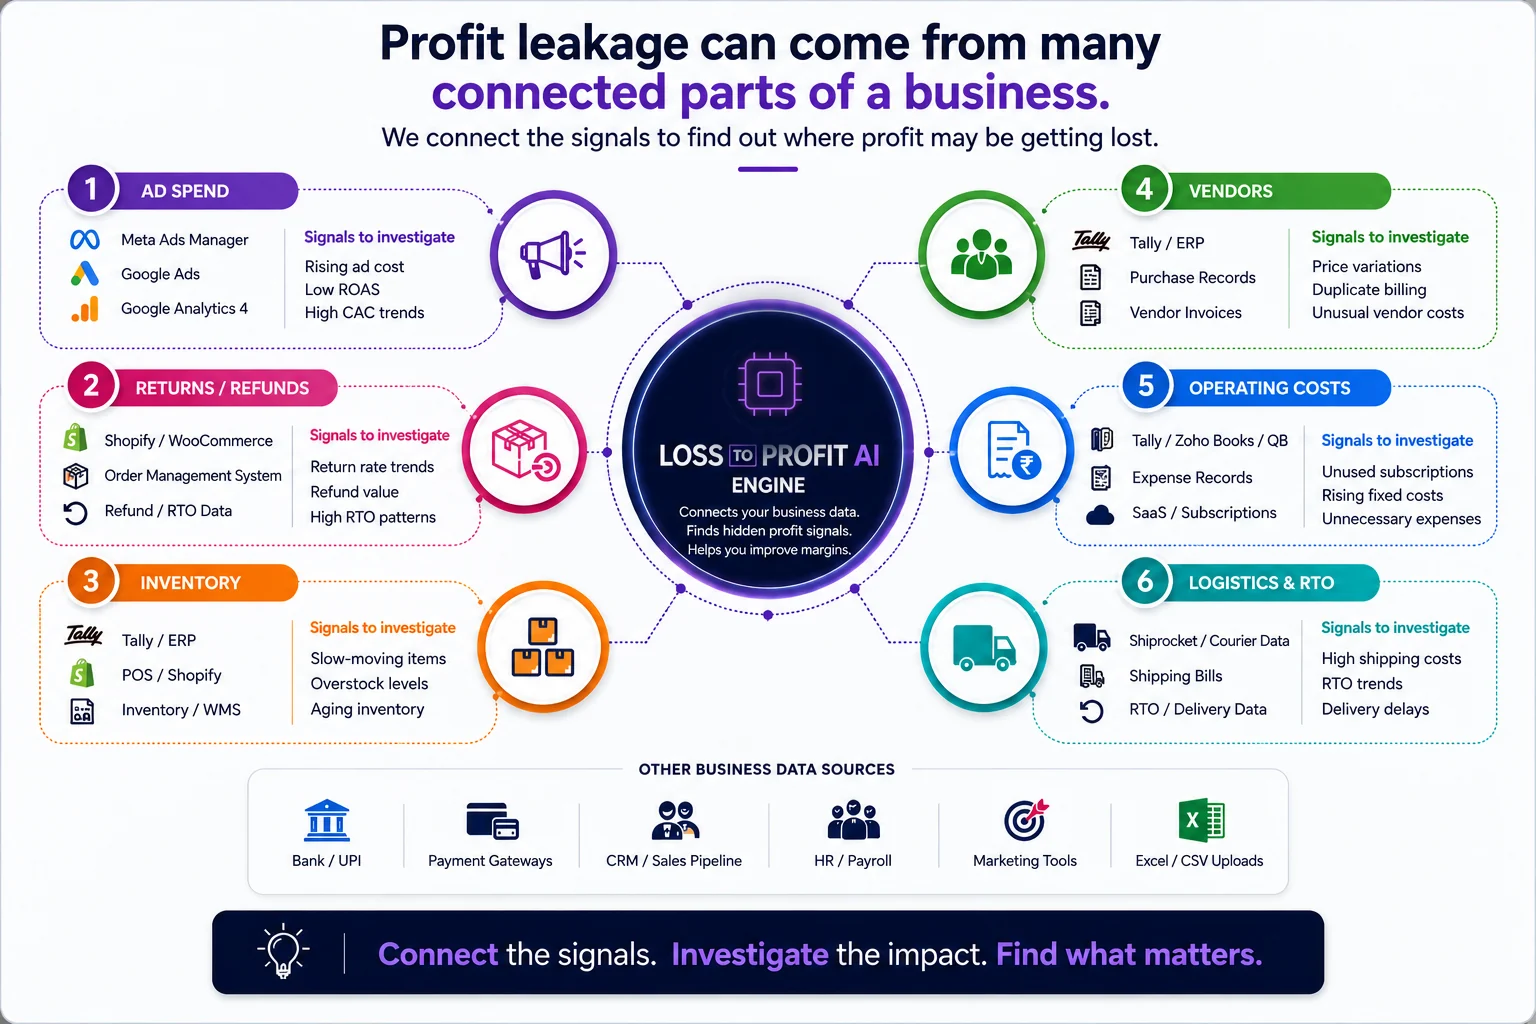
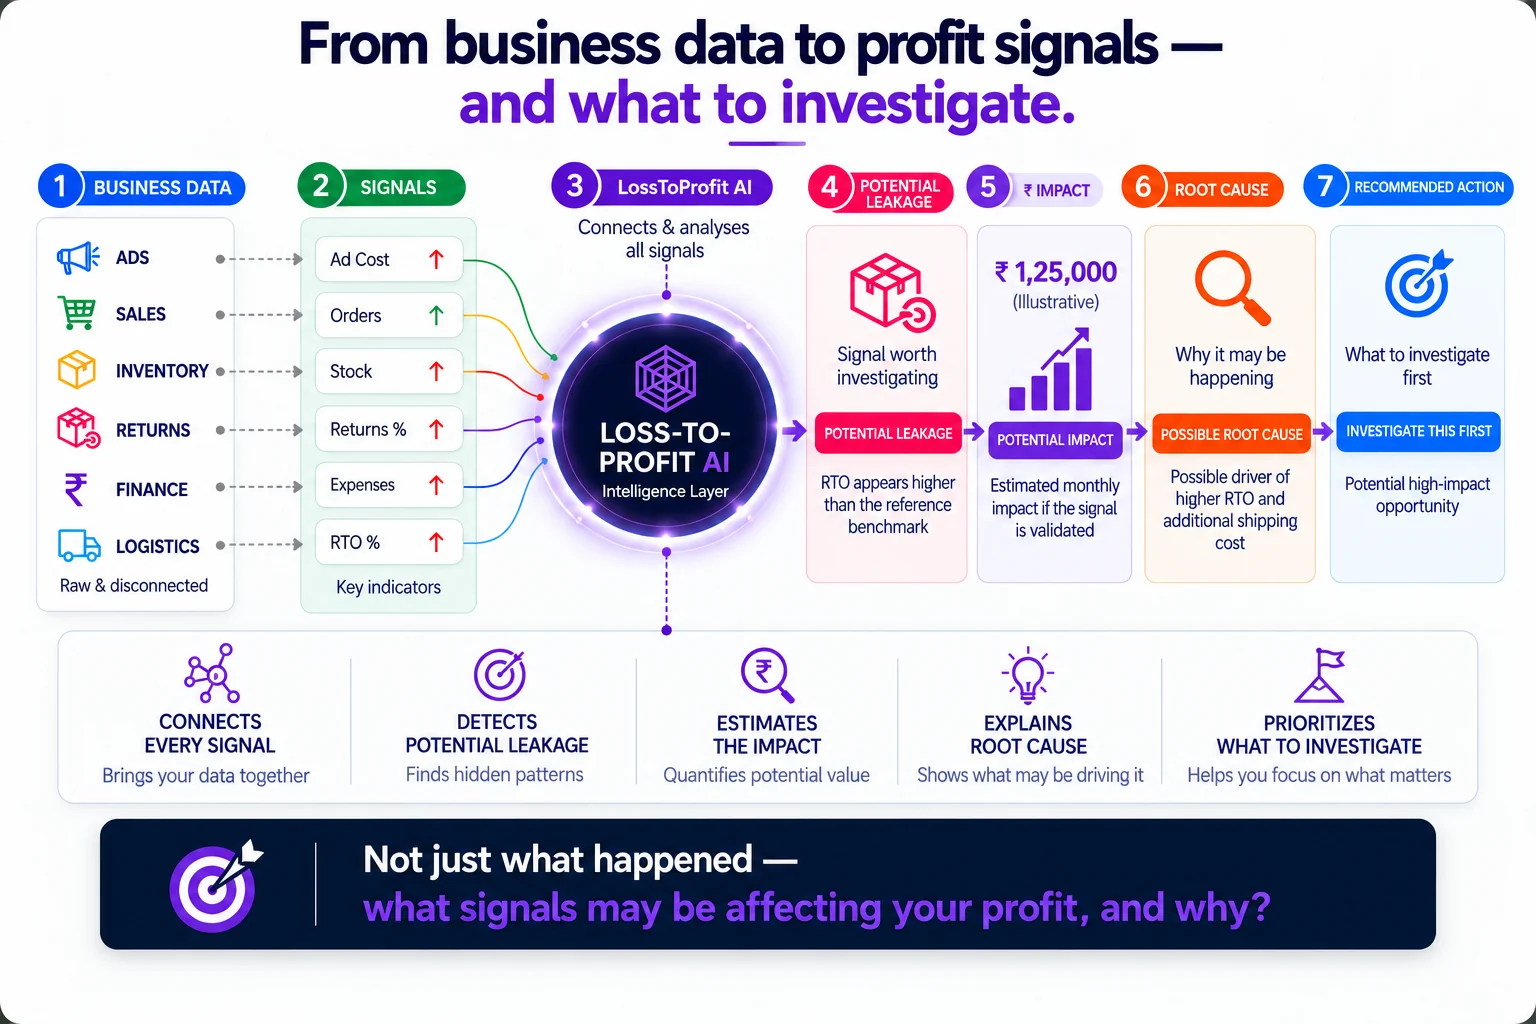
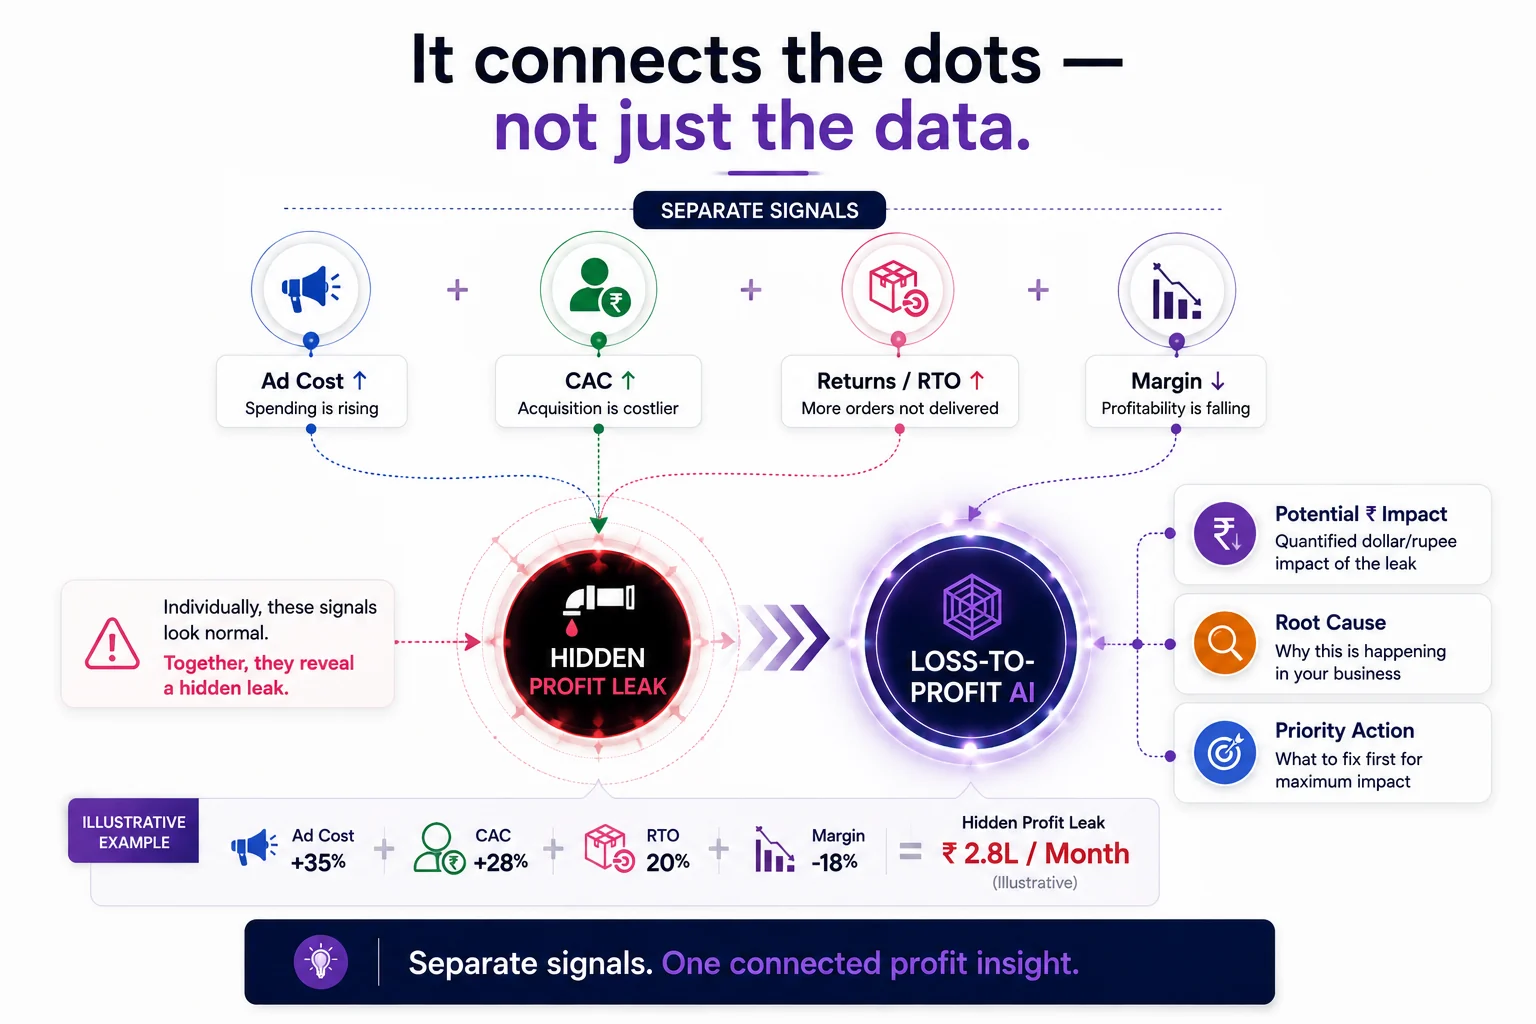
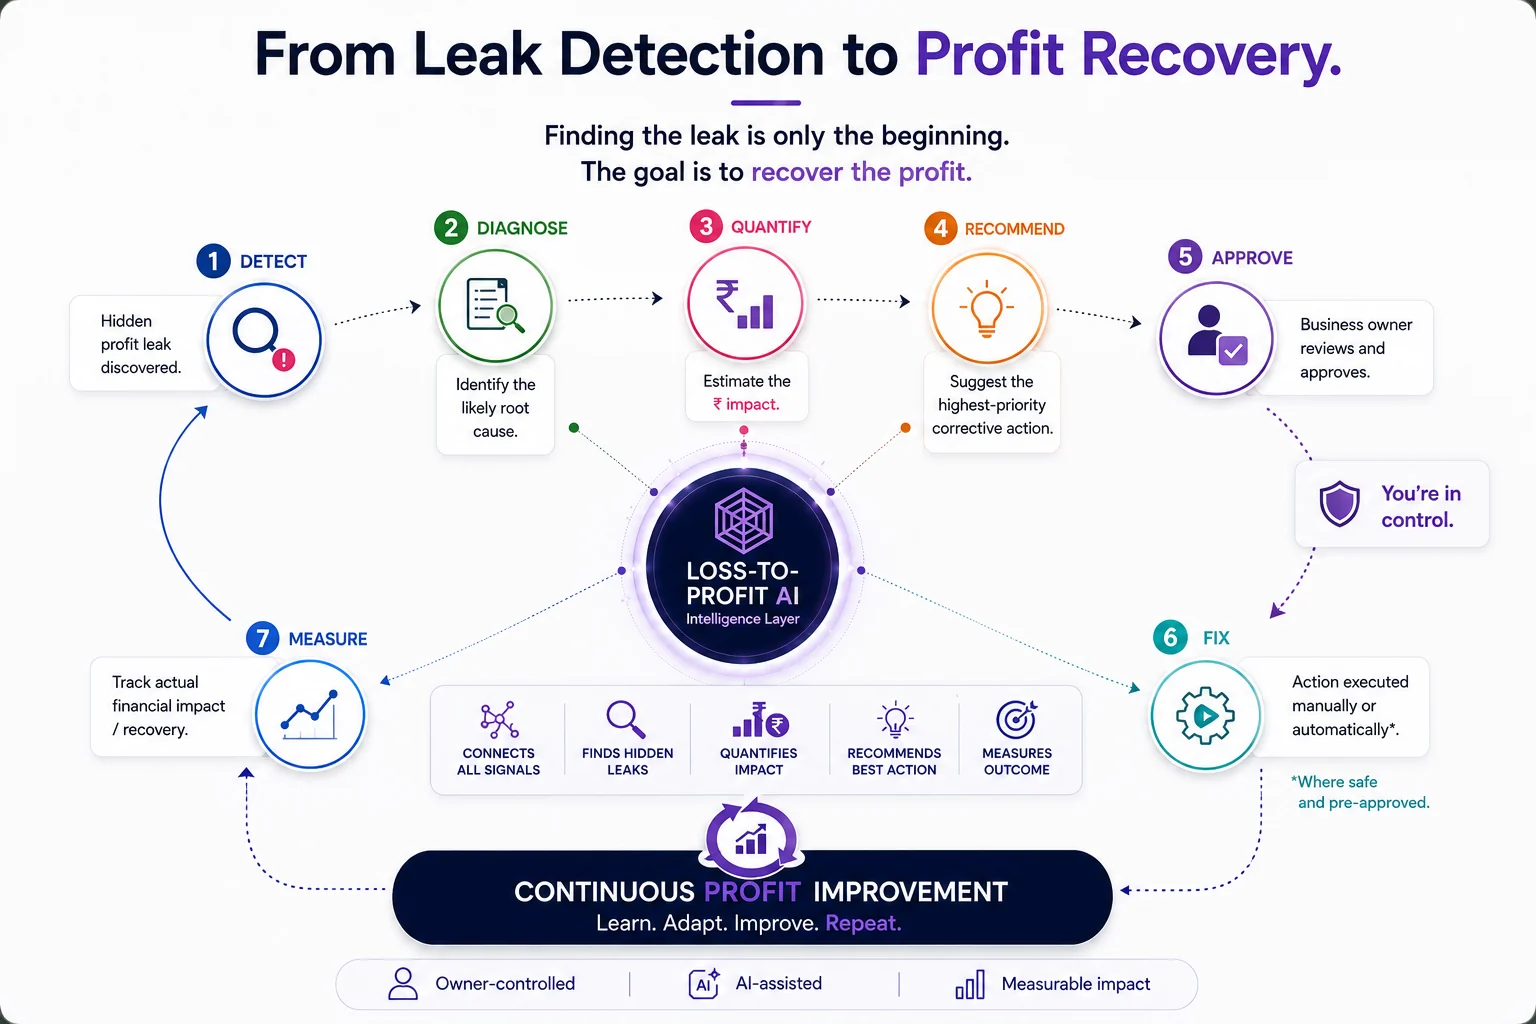
Profit leakage can come from many connected parts of a business.
01 / 06

Profit leakage can come from many connected parts of a business.

We connect the signals to find out where profit may be getting lost. Connect the signals. Investigate the impact. Find what matters.

Live calculator

Move the sliders. Watch the leak.

Six inputs you already know. This runs the same formulas as the full diagnostic, on the four leak areas that can be honestly estimated without your invoices.

Your numbers

Average order value works out to ₹1,000. Every figure here stays in your browser.

Identified profit leakage
₹5.43 L
per month · 13.6% of revenue
Annualised₹65.14 L
Capital locked in dead stock₹12 L

See the full breakdown

Where each rupee is going, ranked by annual impact.

No spam. Your figures stay in your browser — we only receive the summary.

We estimated 4 of your 6 leak areas.

The other two cannot be honestly guessed from six inputs — they need your documents. That is what the full diagnostic does:

  • Vendor / Supplier OverchargeNeeds your supplier invoices benchmarked against 2–3 market quotes for the same spec.
  • Operational Cost CreepNeeds a subscription and bank-statement audit to find what is paid for but unused.
Book a full profit leak diagnostic
The method

Four different rupee figures. We never blur them together.

Most “savings” pitches collapse these into one big number. Keeping them apart is what makes a diagnostic trustworthy — and what makes the recovery figure mean something when it arrives.

Identified Leakage
Money measurably leaving the business right now, calculated from your data. This is the headline figure — and it is not a promise of savings.
Potentially Recoverable
The share of identified leakage judged realistically fixable, decided only after reviewing evidence — one deliberate judgement per leak area, each written down. Always smaller than identified leakage.
Actual Recovery
What was genuinely recovered after the fixes were made and measured. Tracked per action, so the estimate is held accountable rather than forgotten.
Inventory Capital Locked
One-time capital sitting in unsold stock. Reported separately and never added to annual profit leakage — releasing capital is not the same as earning profit.
Next step

Let’s find out where profit is getting lost.

The full diagnostic covers all six areas using your ad, order, inventory, vendor, subscription and courier data — and ends with the three actions worth doing first.

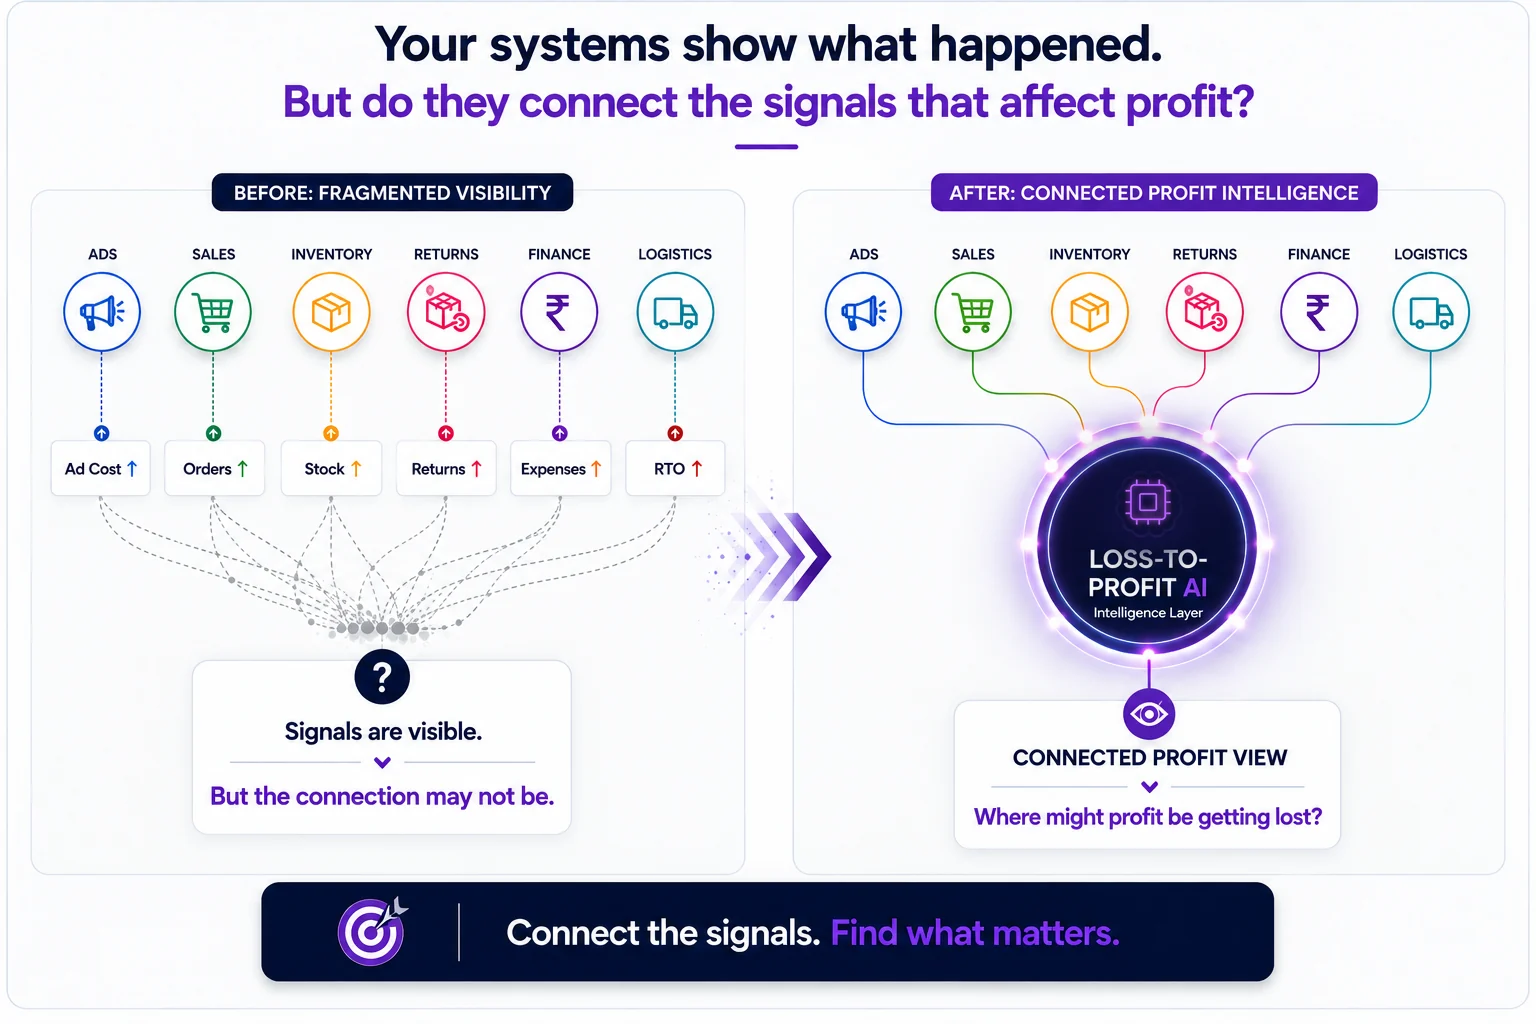
  1. DataAds, orders, stock, vendors, costs, couriers
  2. DetectSignals worth investigating, across six areas
  3. QuantifyEach leak in rupees, with its working shown
  4. ActThe three actions worth doing first
  5. MeasureActual recovery, tracked against the estimate